A Diversion on Declining Hunters...
Much activity and fuss has been made over declining hunter participation rates over the last 5 years. Spurred by data from the National Survey on Fishing, Hunting and Wildlife-Associated Recreation , a number of organizations have put together programs to recruit, retain and reactivate hunters (R3 as it were). While the decline on a national level seems sufficiently supported by the national survey, estimates at finer geographies are more tenuous.
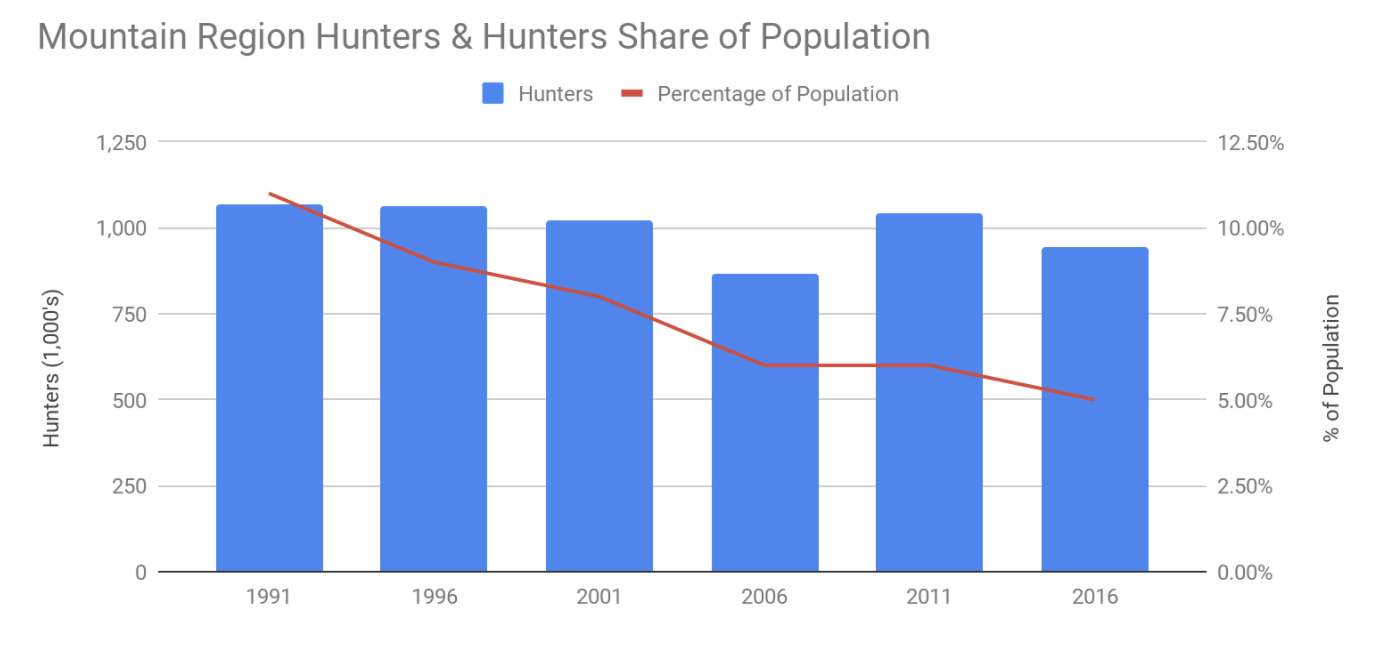
Take the Mountain Region for instance. While the population has grown tremendously over the last 20 years, the national survey suggests that hunter numbers are flat to declining. While the raw change in hunter numbers from 1991 to 2016 shows roughly a 10% decline, survey sample sizes make conclusions about gross hunter numbers difficult to quantify without significant error. The standard deviation on 2016’s Hunter rate for the Mountain Region is around 146,000 and the gross number is at the boundary of what the report says is a reliable aggregate estimate. So are there fewer hunters in the Mountain Region? Maybe...maybe not.
If you are an Arizonian, Coloradian, Idahoian, Montanan or Wyomian and scratch your head when people say we need more hunters but see more trucks at the trailhead each year...you might not be crazy. There is a good chance that hunter numbers in your neck of the woods haven’t declined in total, even though they are declining as a share. So what’s hunter participation got to do with draw odds and point creep? Well, you might be wondering like us, how can participation be going down if we hear of point creep? So we were tempted to theorize about hunter numbers through the lense of draw statistics.
After all, draw statistics also show how many folks are wanting to participate in hunting. The more folks applying for draws, the harder it should be to draw and hence there must be more hunters right? Well, not exactly. Draws are a complicated process. There are influences like total quotas, hunter demand for one area vis-a-vis another, changes to OTC licensing and other factors that influence draw statistics. It's very possible for hunter preferences to change faster than management strategies. So hunters may apply overwhelmingly to units nearer population centers or units that have produced a string of trophies lately even though the underlying herd objectives are constant. All this is to say, after further thought it seems like a more careful study would be needed to link patterns seen in draw data to changes in hunter numbers. In other words, we’ll just focus on draw stats and set hunter numbers aside for now.
Is Systemic Point Creep Real?
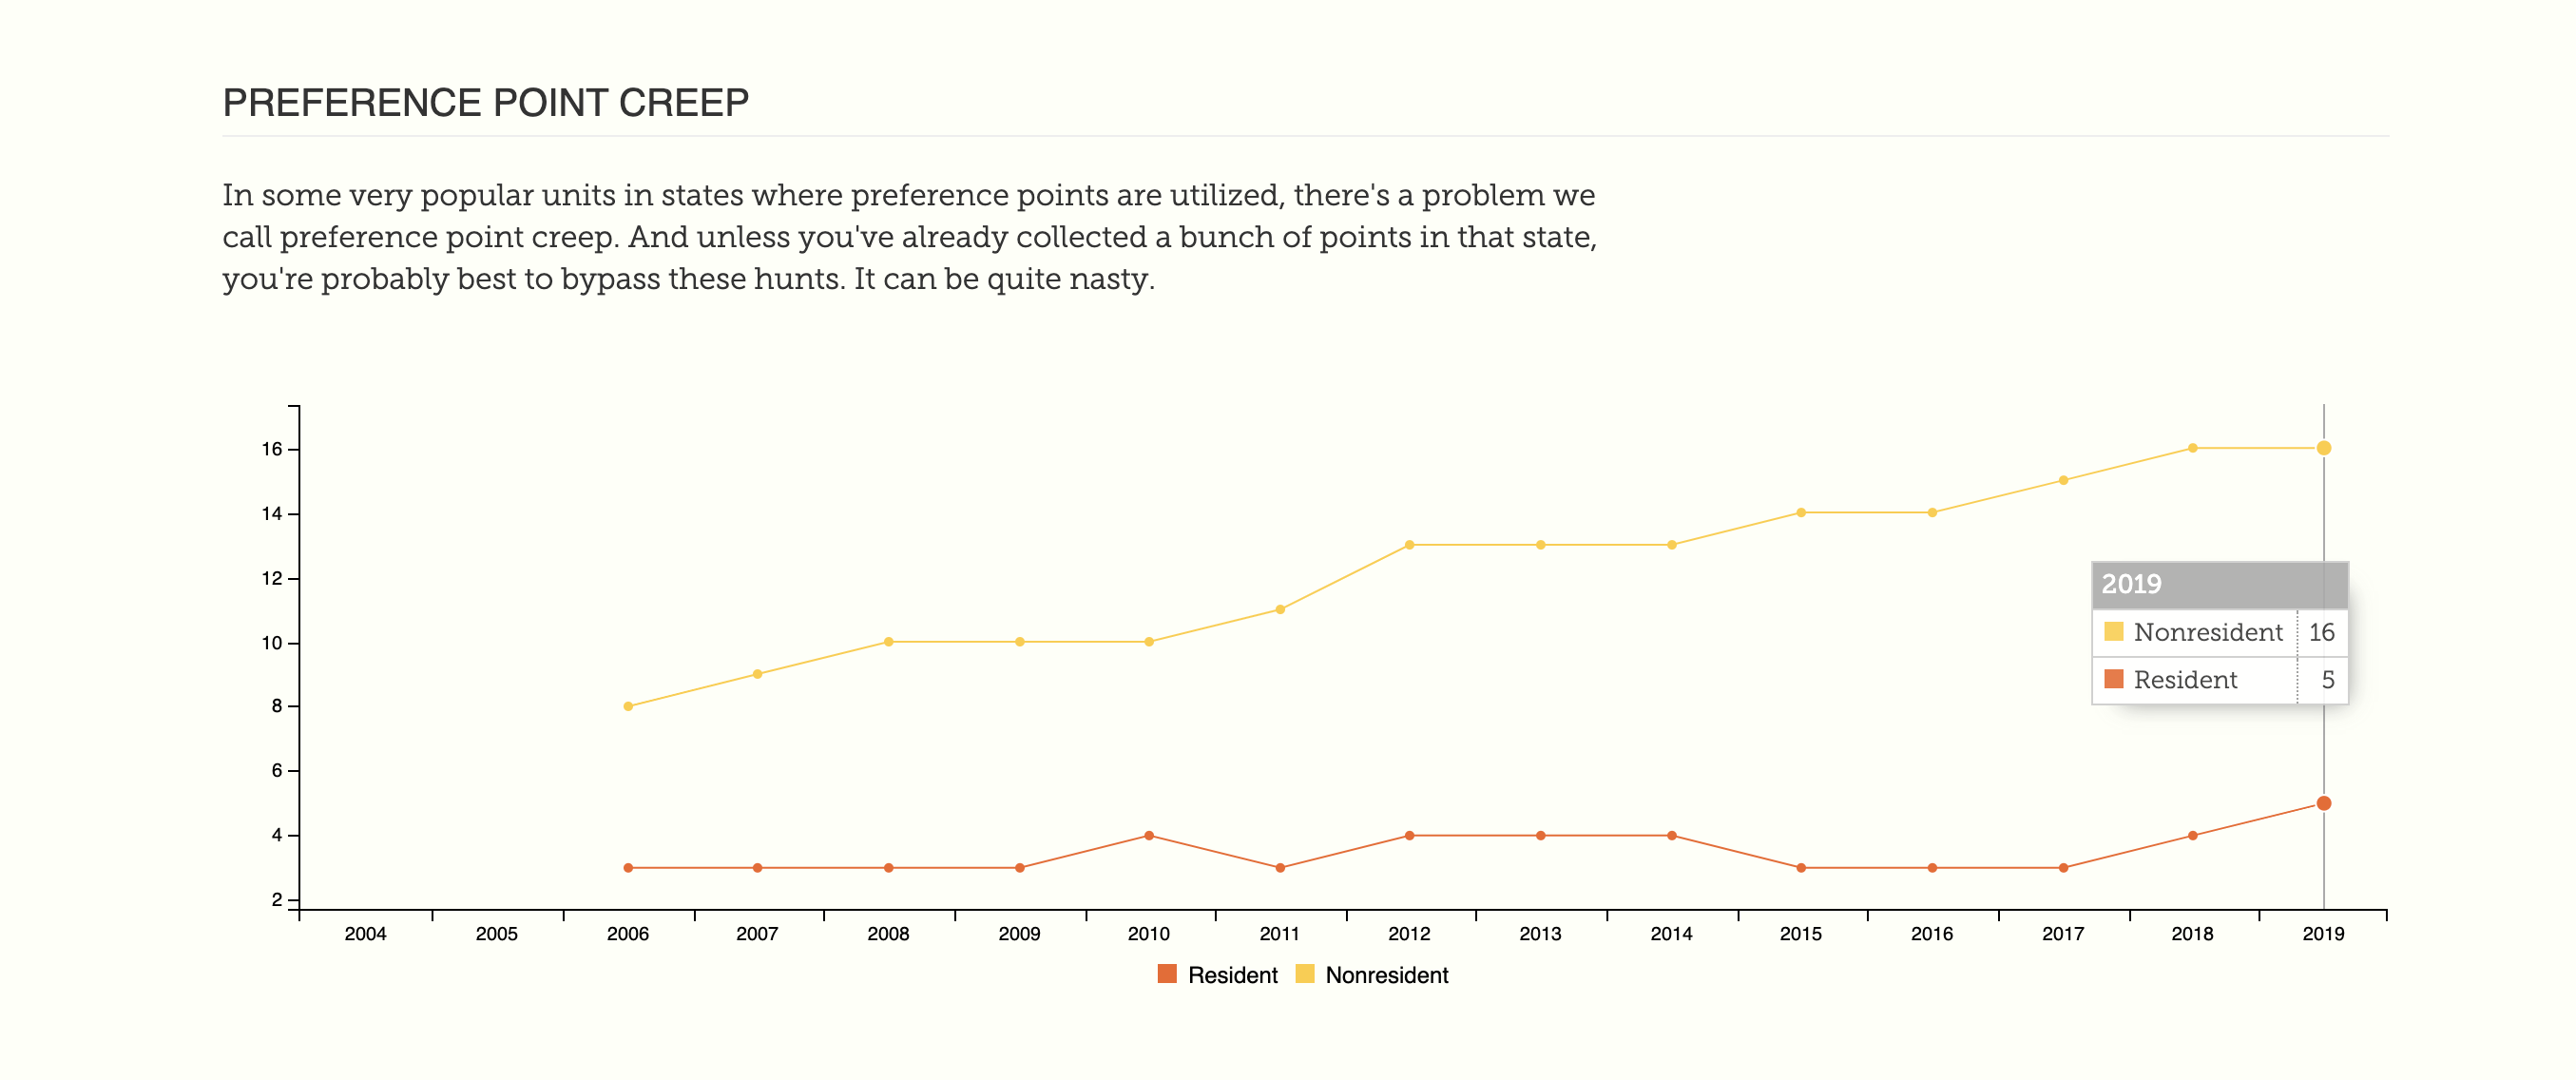
First let’s define what we are trying to suss out. Point creep can be different for residents and nonresidents. It also can very quite a bit by species. So let’s define point creep as the continued increase in the minimum number of points needed to draw a tag. Below is a nice example for Unit 66 in Colorado during the first season muzzleloader for bull elk. Nonresident points have steadily climbed over the years and resident units are climbing the last two years. Nonresidents are experiencing persistent point creep but residents aren’t so much.
While it is easy to define point creep for one draw tag it can be tricky to tell if this is systematic across all draws. We’d like to understand for a particular residency and species in a state if there is systematic point creep (or draw odds creep). Making general statements like “It’s getting harder to draw an elk tag in Colorado” or “Damn, given draw odds a guy outta be hunting lope in Wyoming!” isn’t an easy thing to decipher. This is important because state management agencies try to balance hunter sentiment with population objectives. If hunters all think the system isn’t working because they can’t draw the tag they want...it’s kind of an issue.
Case Study: Colorado Resident Elk Tags
Typically when analyzing systems or collections of data, we look toward statistics and distributions to understand what is happening. We’ll dig into the HuntScore database and use Colorado resident elk draws to flesh out some different approaches on understanding systematic preference point creep. Once we know how to measure preference point creep we can easily apply it to different states, species and classes of residents.
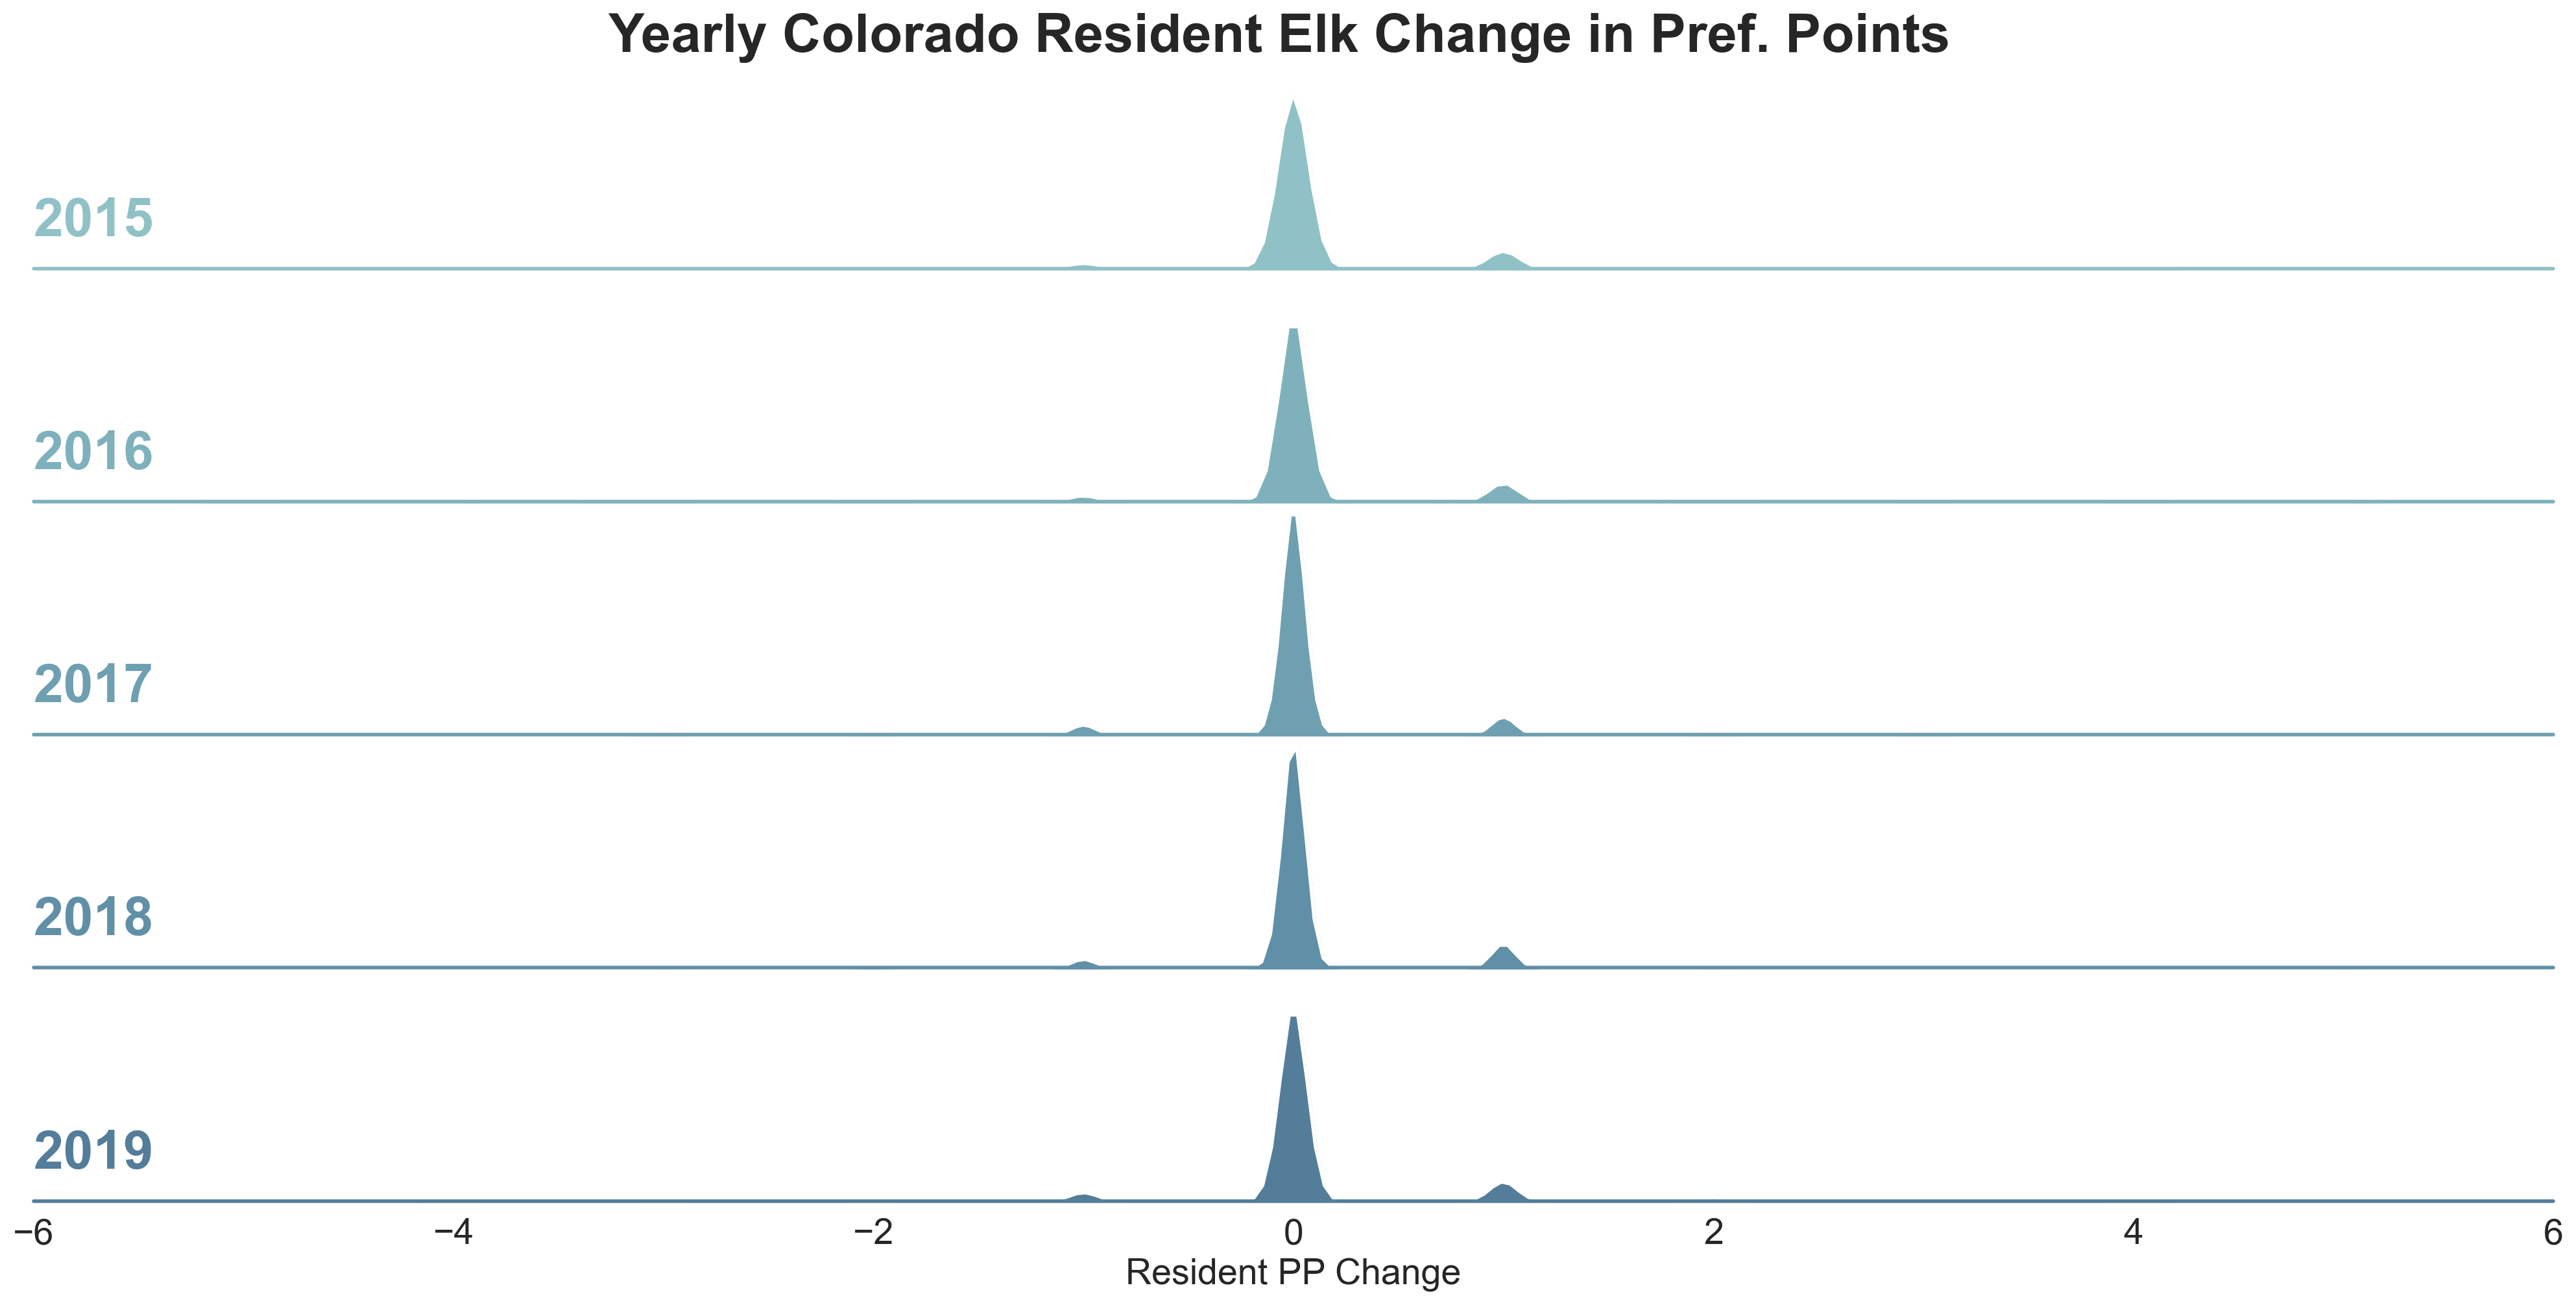
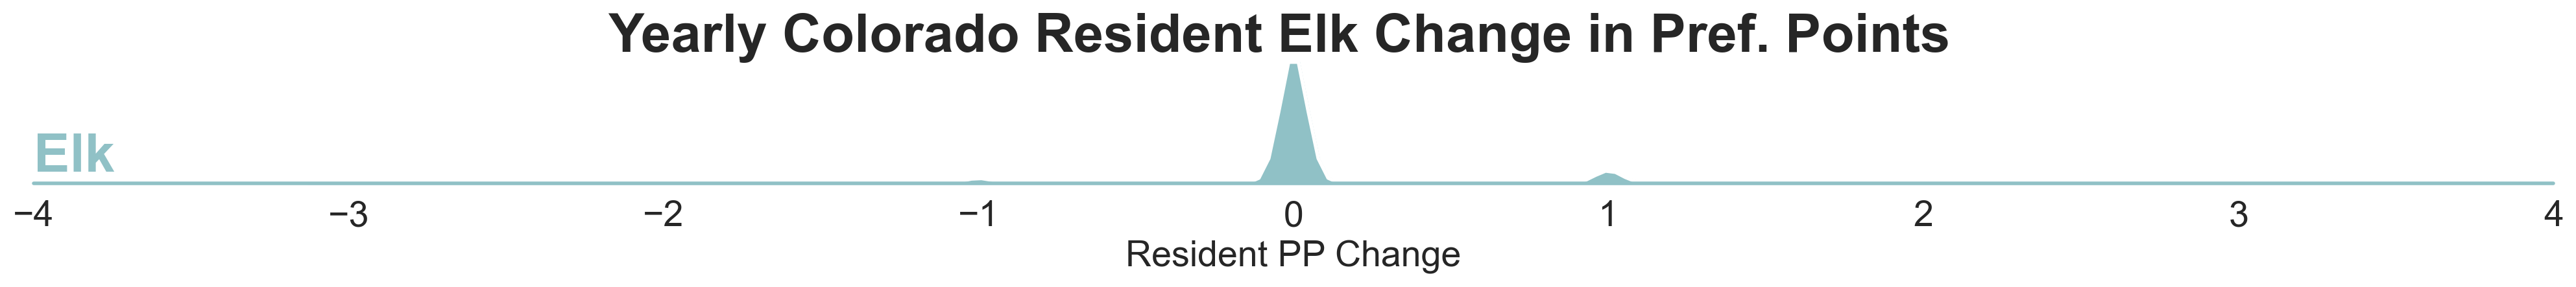
One approach would be to look at the yearly change in pref points needed to draw a tag. By analyzing how many hunt codes had an increase or decrease and plotting it, we might hope to see a consistent pattern. Above we can see patterns are pretty consistent year over year. Most hunt codes experience no change in a given year. However a small batch every year seem to increase while an even smaller batch see a decrease. In 2019 the majority of units saw no change but there are small peaks to either side at +/-1 point. So some units increased while others decreased. Overall we might say that their seems to be more increase then decrease...but for a minor number of hunt codes.
If we collapse all the yearly changes onto one plot, proportionally it still looks like point creep isn’t an issue in general. We see a small peak to the right of zero. However it doesn’t look large. Plus, we don’t really know if it is the same unit experiencing year of year increases. We could iterate on this idea and take the minimum preference points a hunt code starts with at period t and where it ends at t+n and compare the change.
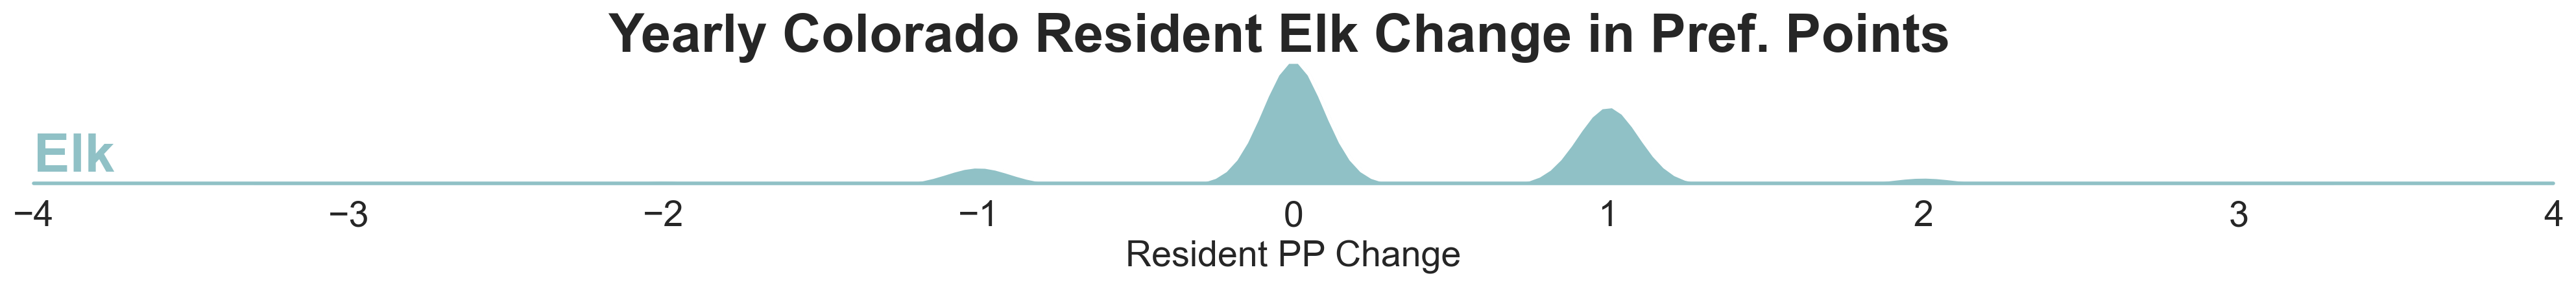
If we do that...there still doesn’t appear to be systematic increase. While this is true in general, it happens that most hunt codes require no points to draw. Removing zero point codes might provide a different picture. We might limit it to only those codes that have at least 1 preference point starting in 2016 and see how that impacts the above graph.
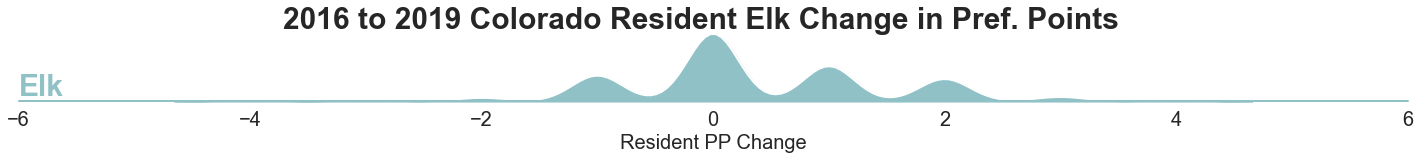
Now we can see some changes, however we’ve dropped 75% of all available hunt codes. In examining the plot, we can see more weight distributed to the right of zero than to the left. So there does seem to be general point creep for already in demand tags. However, in the 3 prevailing years the typical unit experienced none or one point increase. So while point creep does exist it is not systematic for resident elk hunters in Colorado. This analysis would suggest that perhaps 10% of draws are impacted.
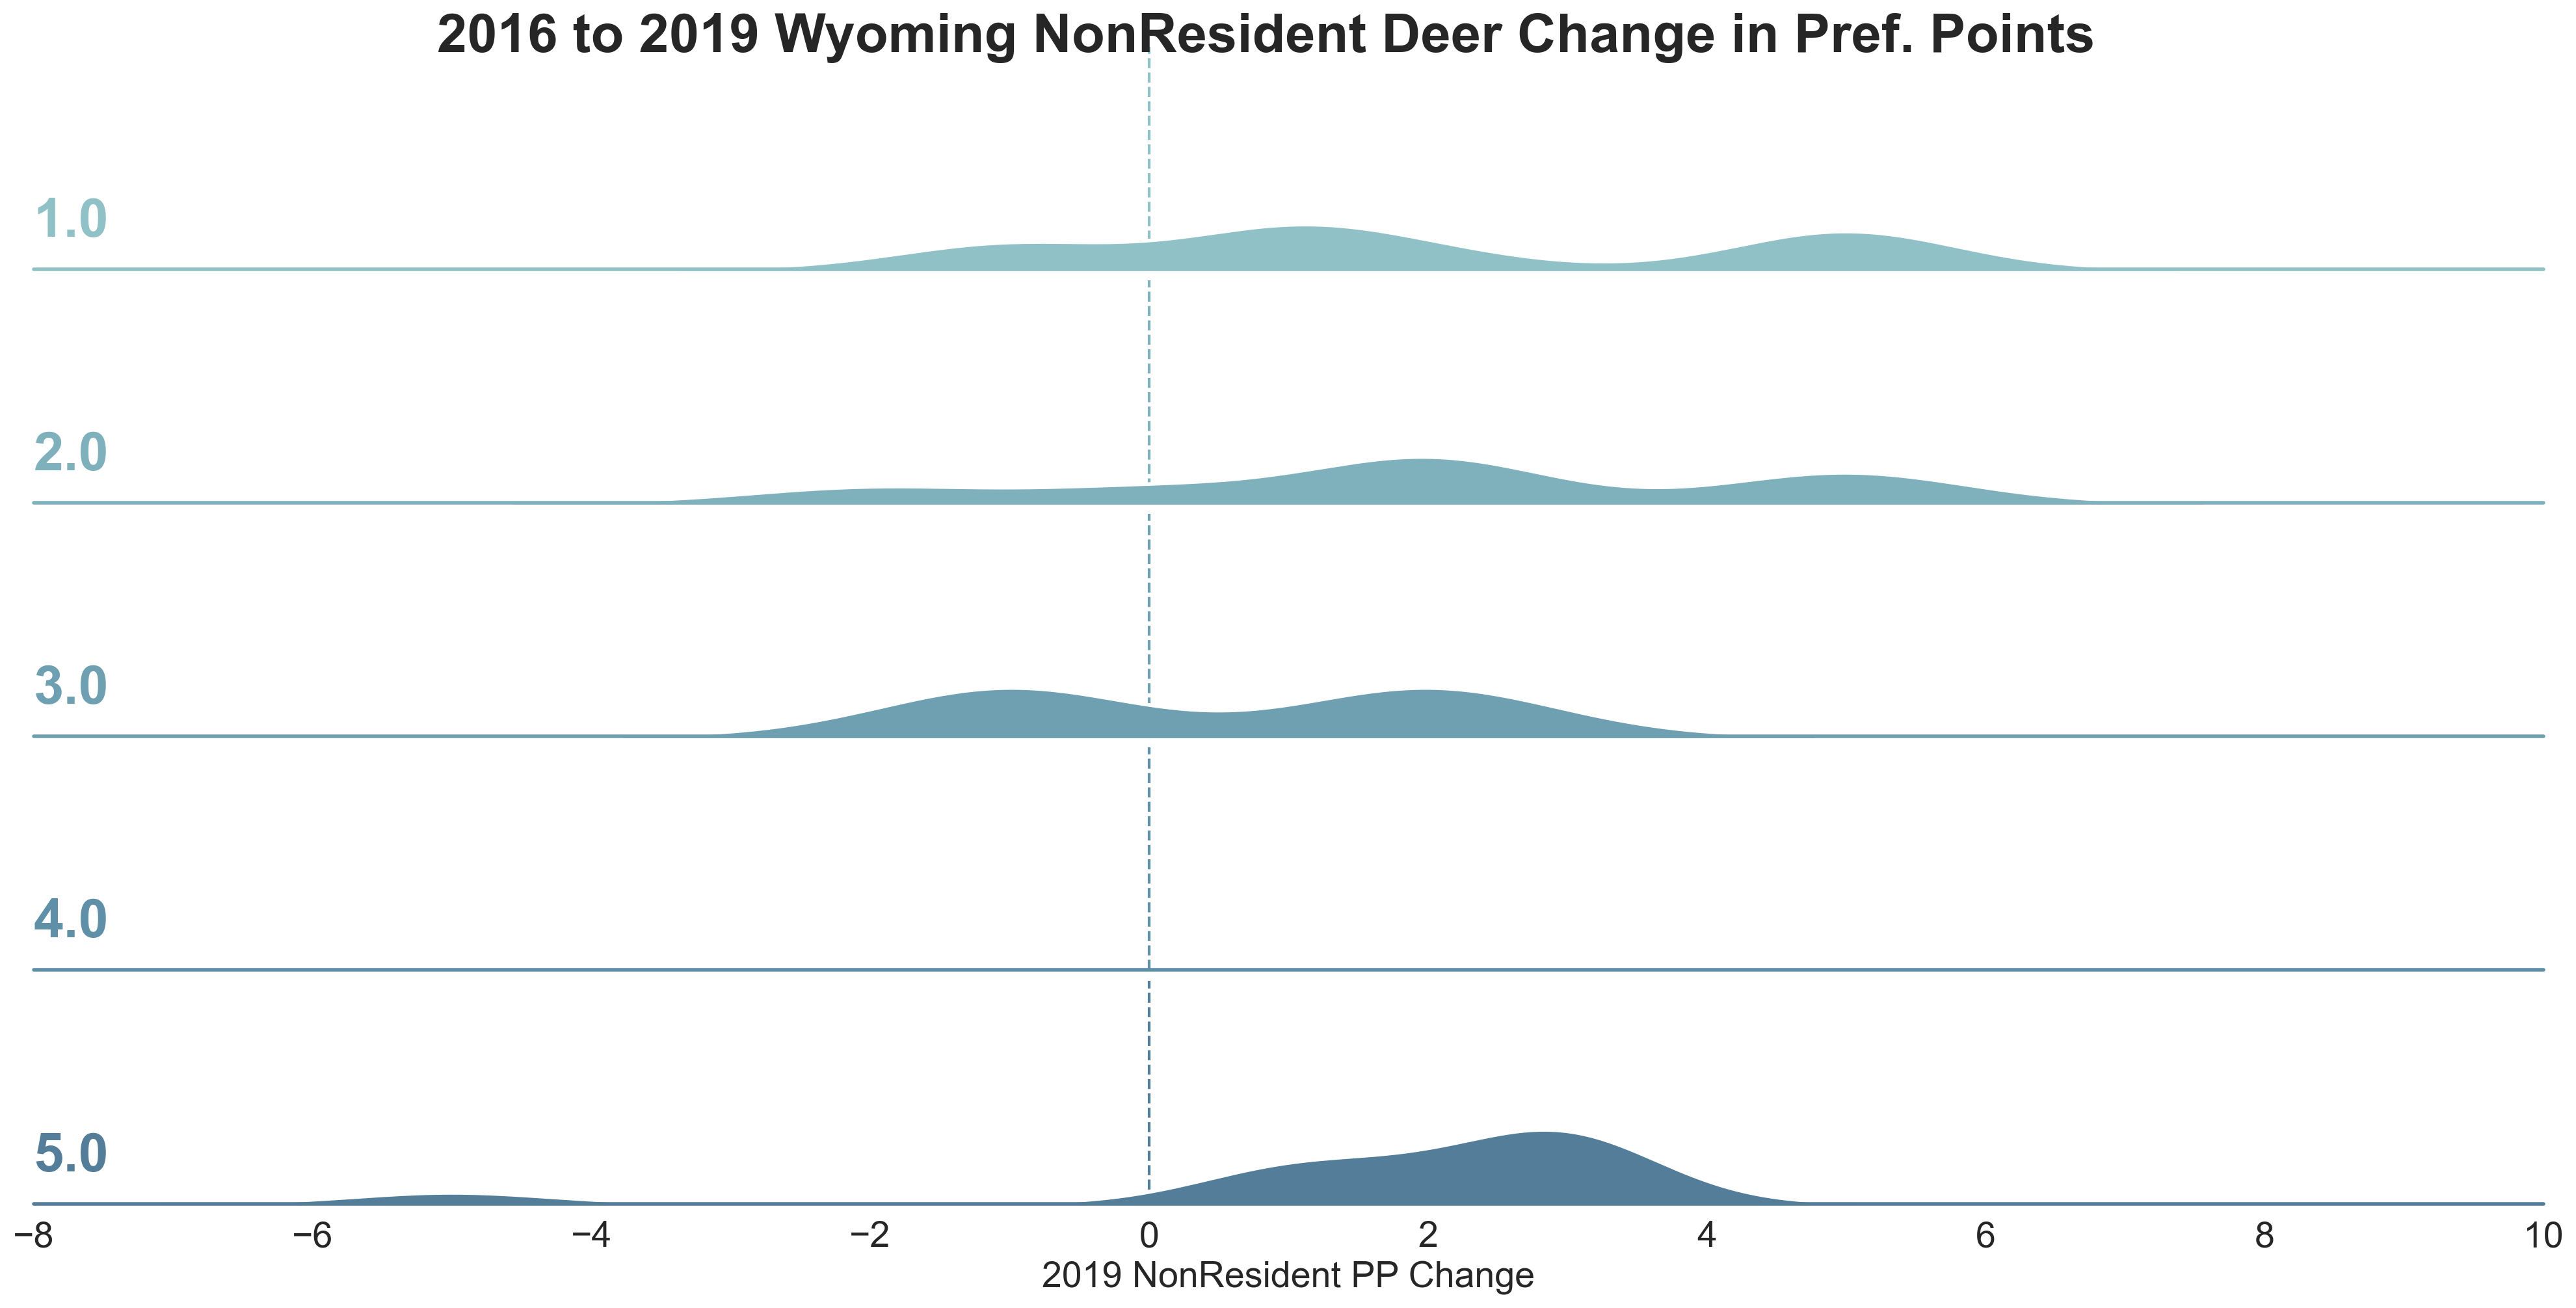
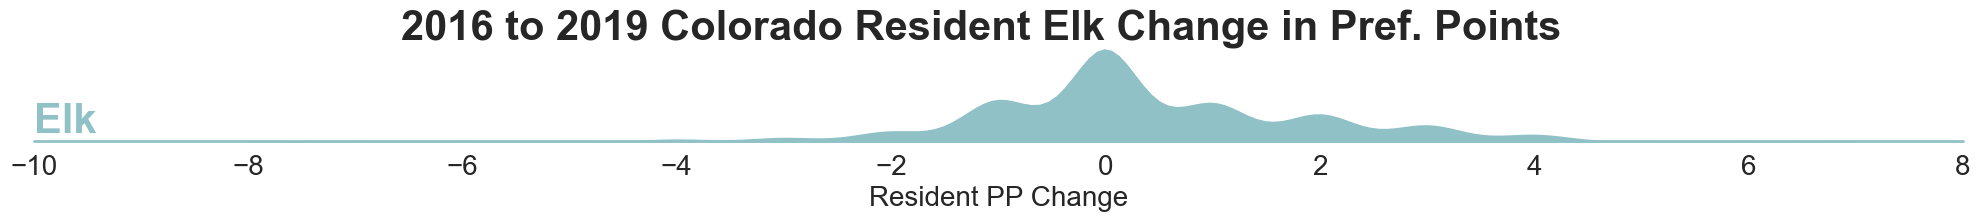
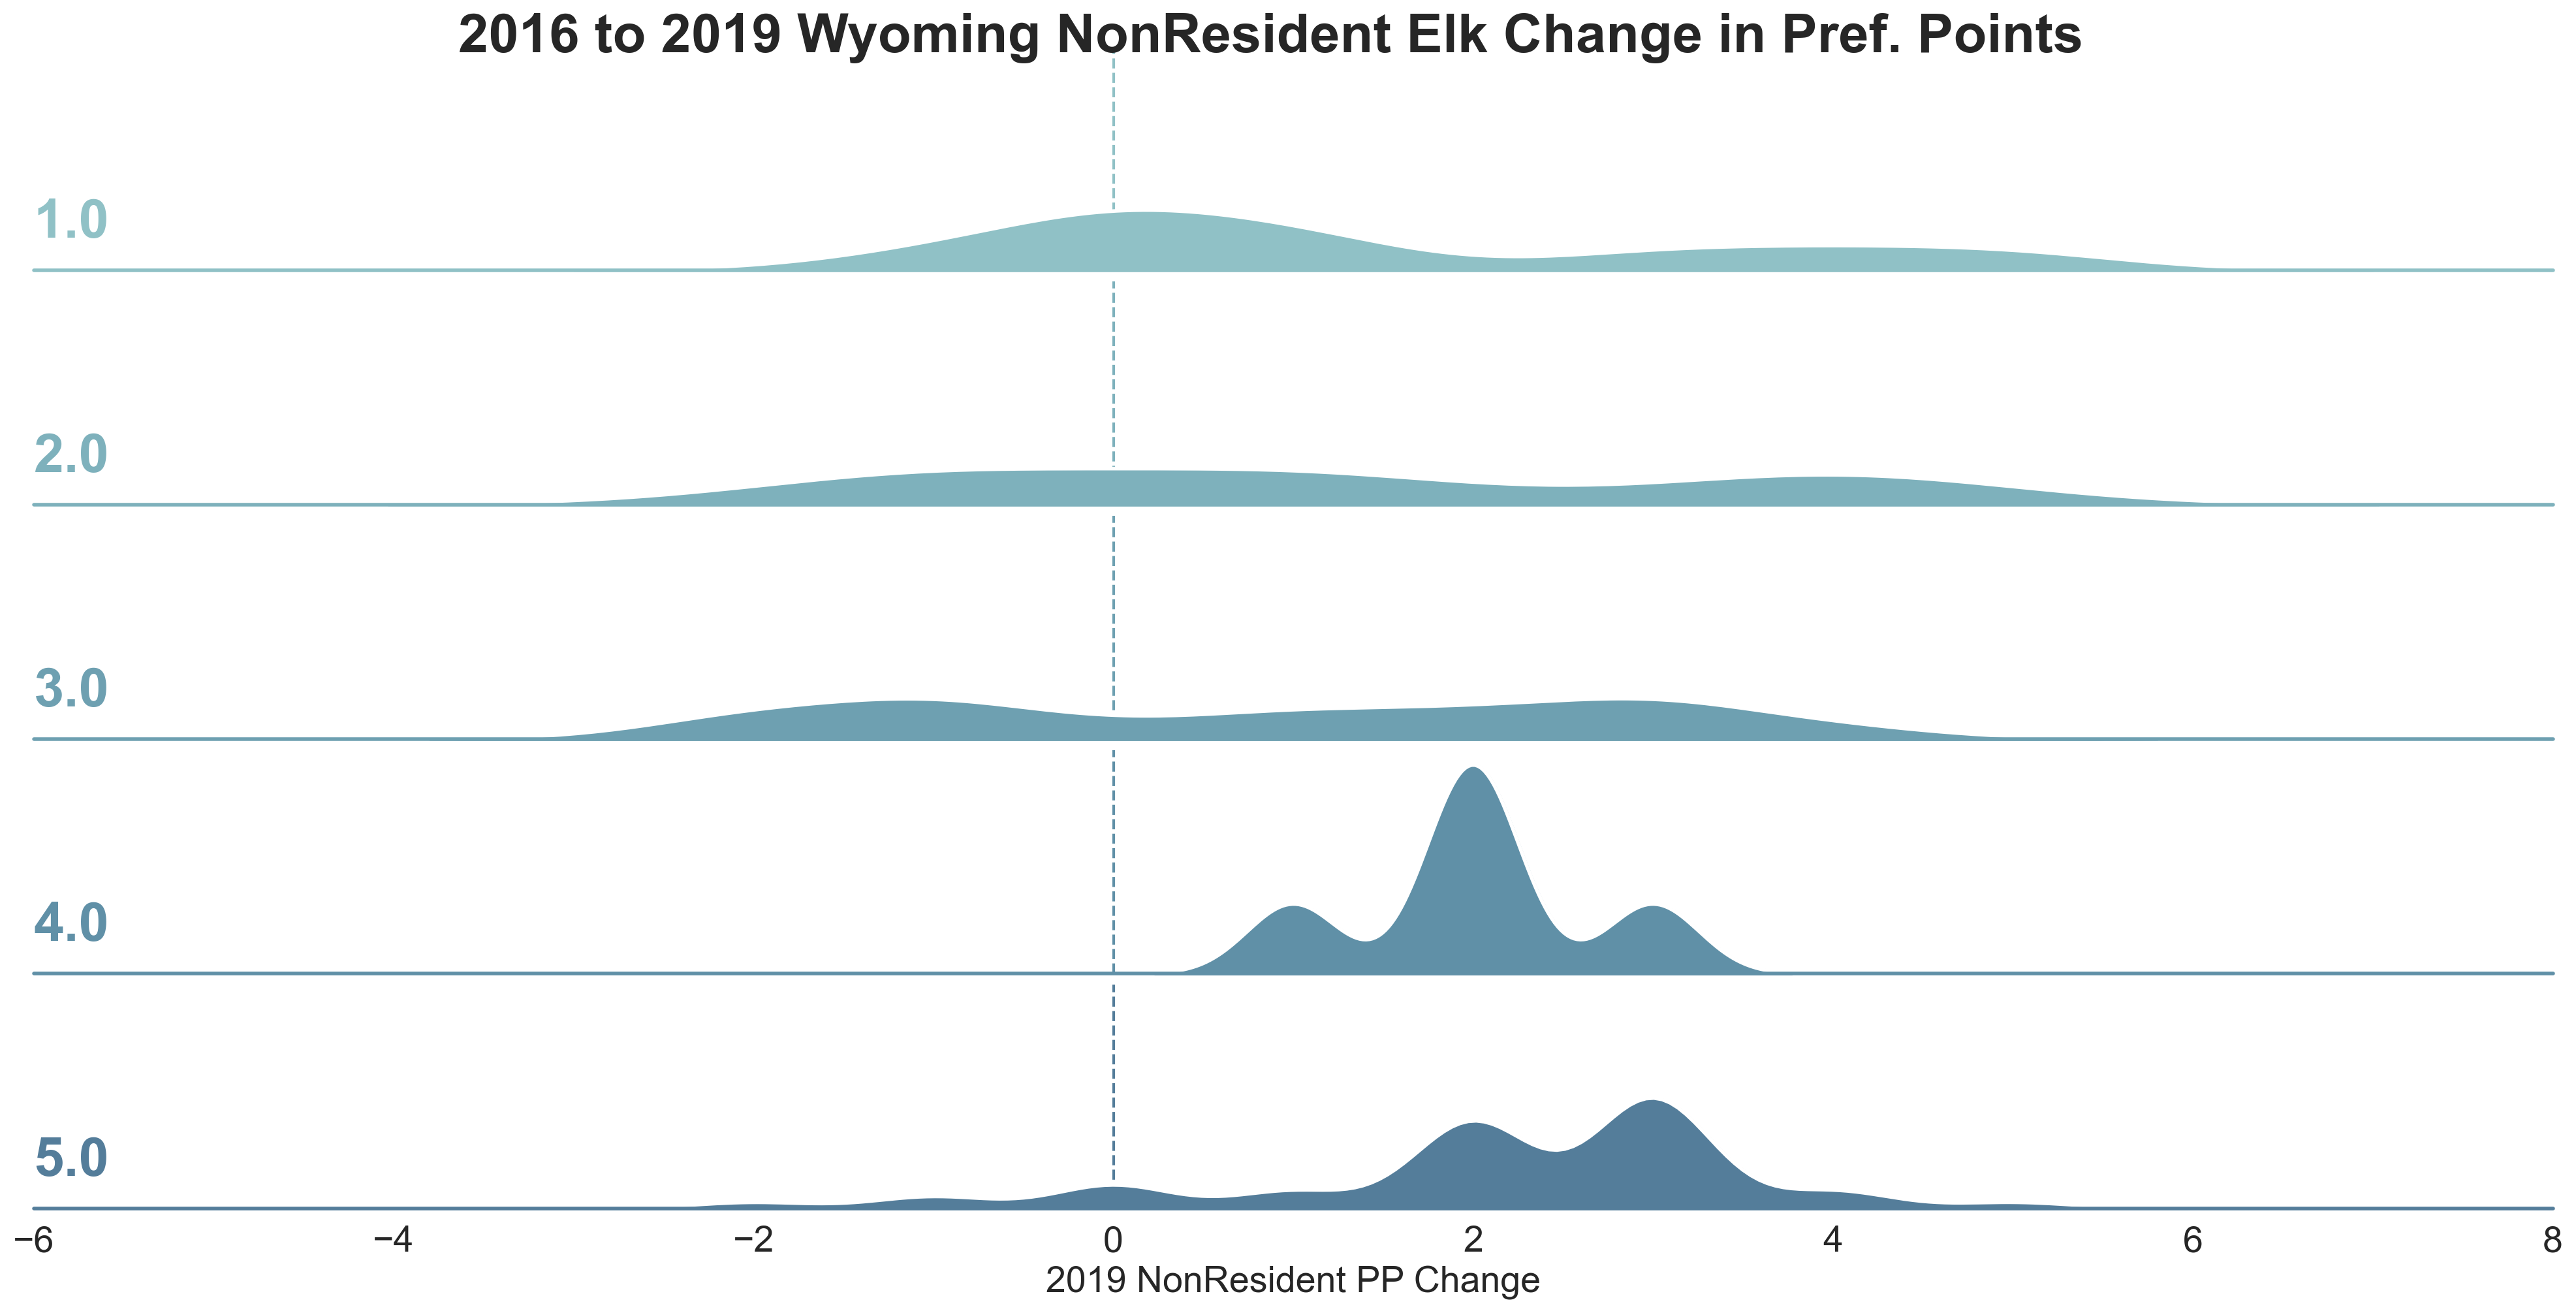
Finally, we might look at point creep across minimum preference point bands. This approach gives us an idea of where point creep is greatest.
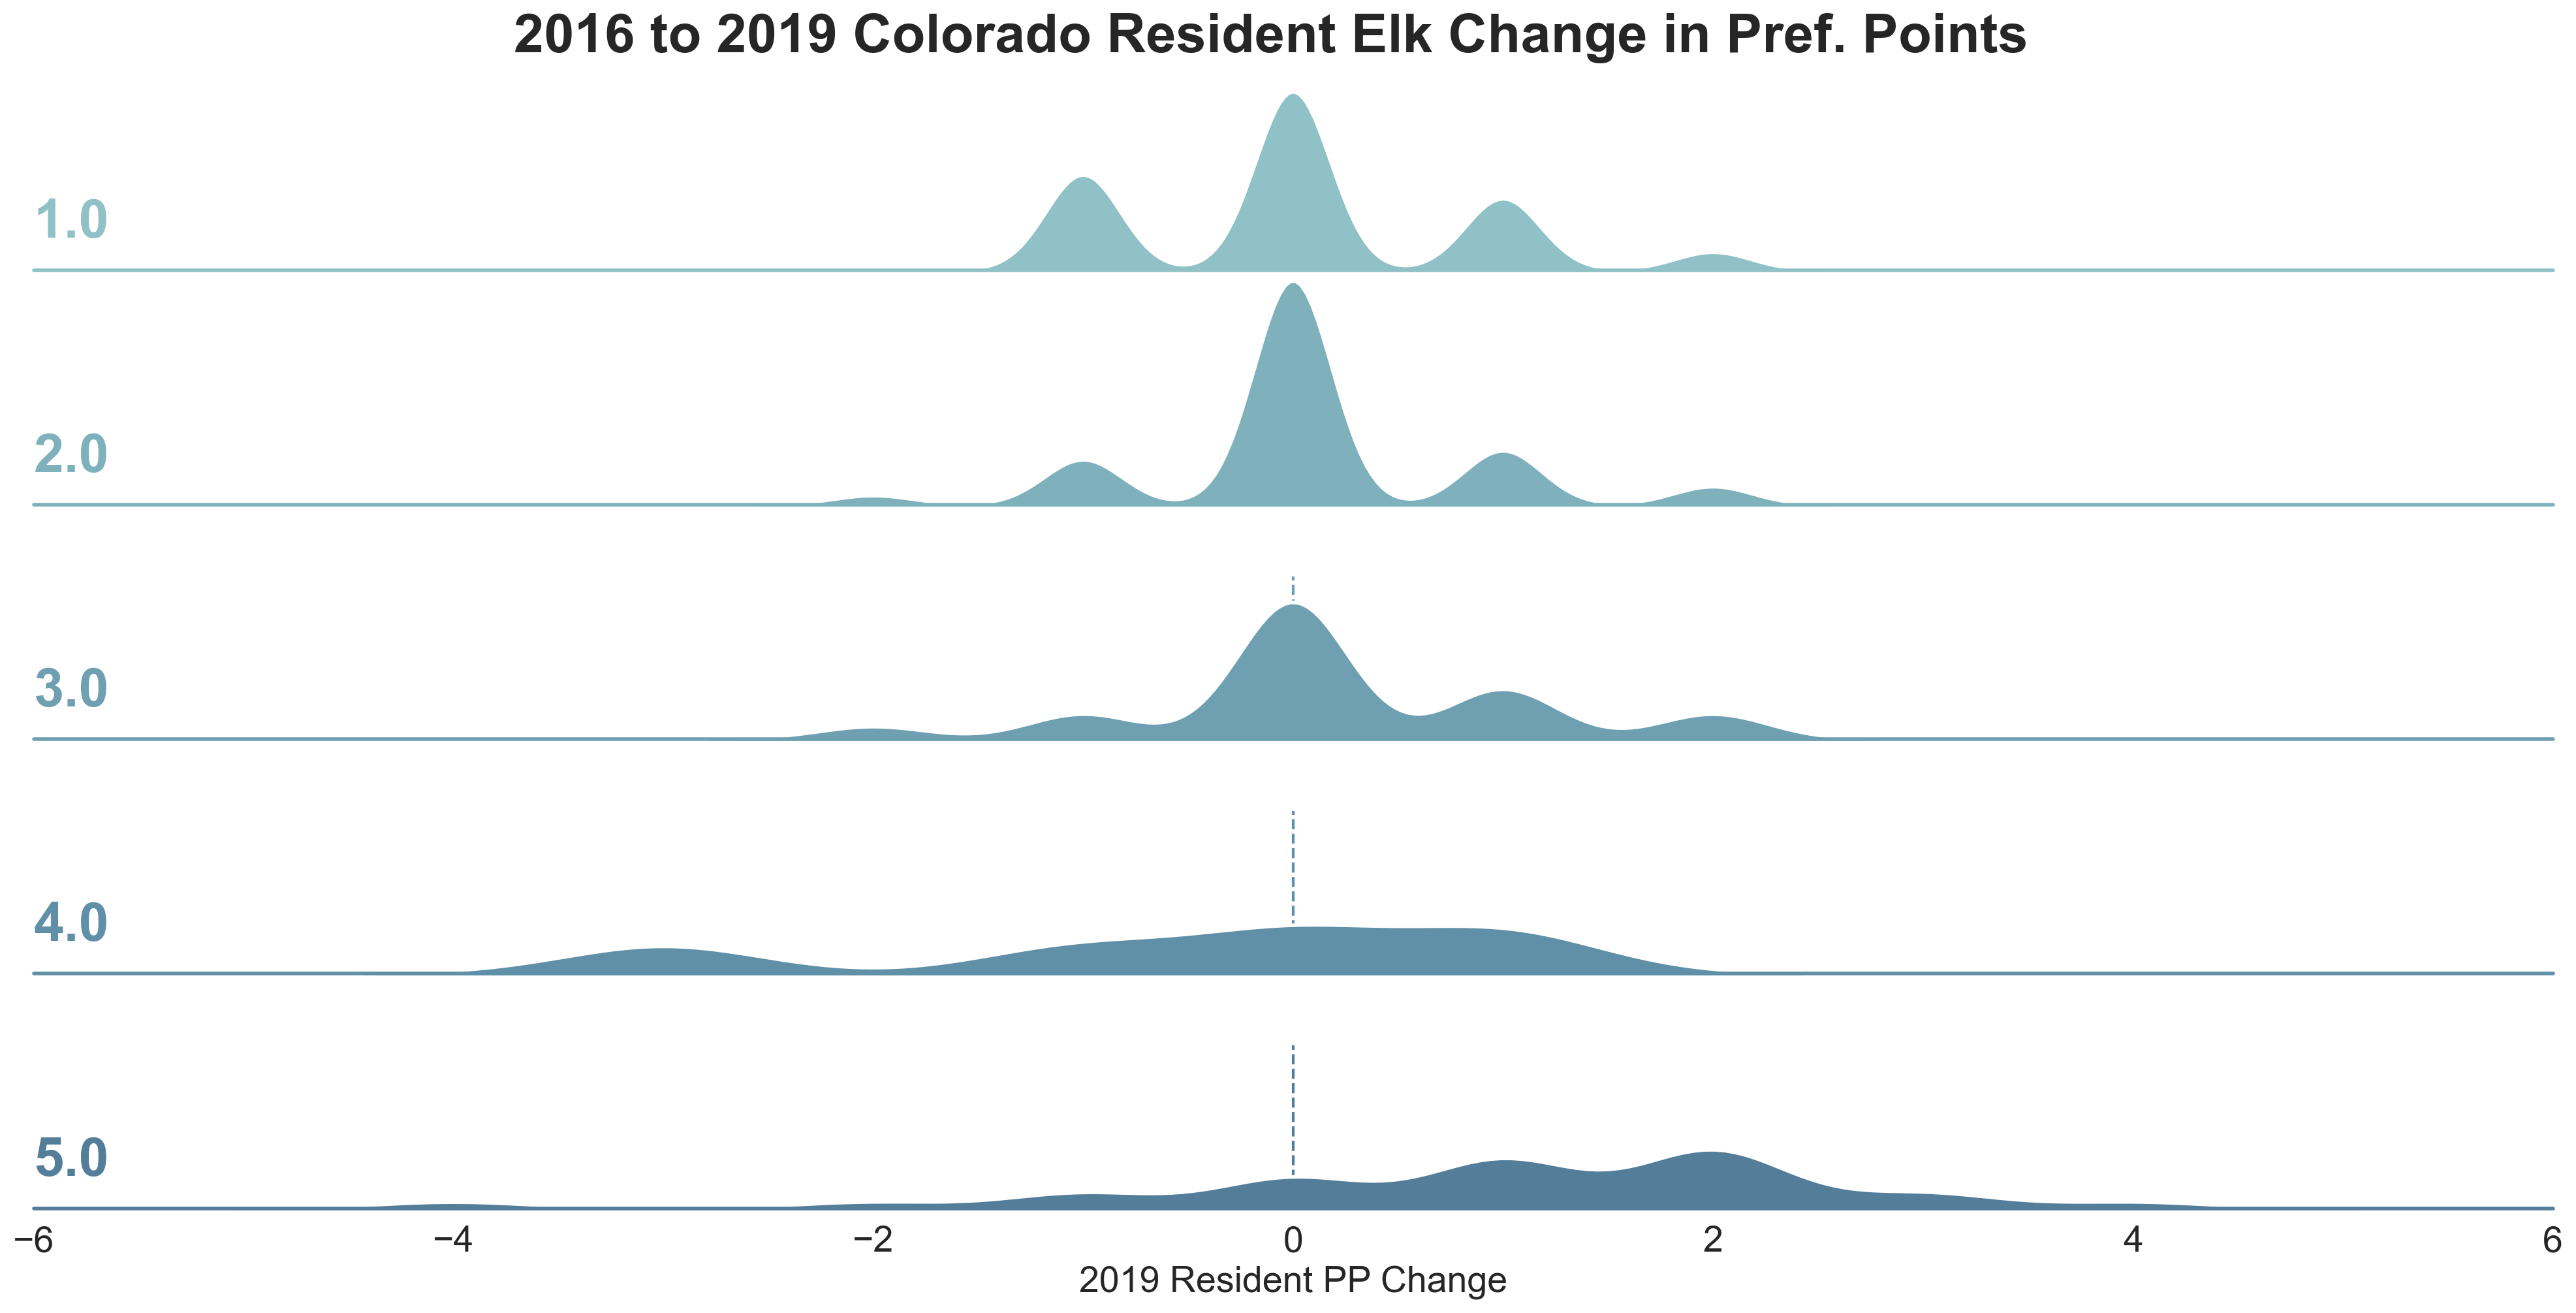
What we really have is point creep in the toughest to draw hunts. 5 includes all draws at or above a minimum of 5 preference points. At 5 or more preference points it has become undoubtedly harder to draw a tag. So if you’ve been waiting 5 years you might have to wait 6 years and so on. If you like to get after it and apply to units with 3 or fewer preference points, life really hasn’t changed much.
So the takeaway is we don’t see systematic preference point creep for resident elk hunters. Only the hardest to draw units are getting harder. What implications this has for wildlife managers in assuaging concerns of hunters? Well, maybe none. After all, not that many hunt codes experience point creep. On the other hand, maybe the drivers of hunter demand for a few select tags indicate that there are starting to be fewer quality tags available. More research is needed to tease out such learnings.
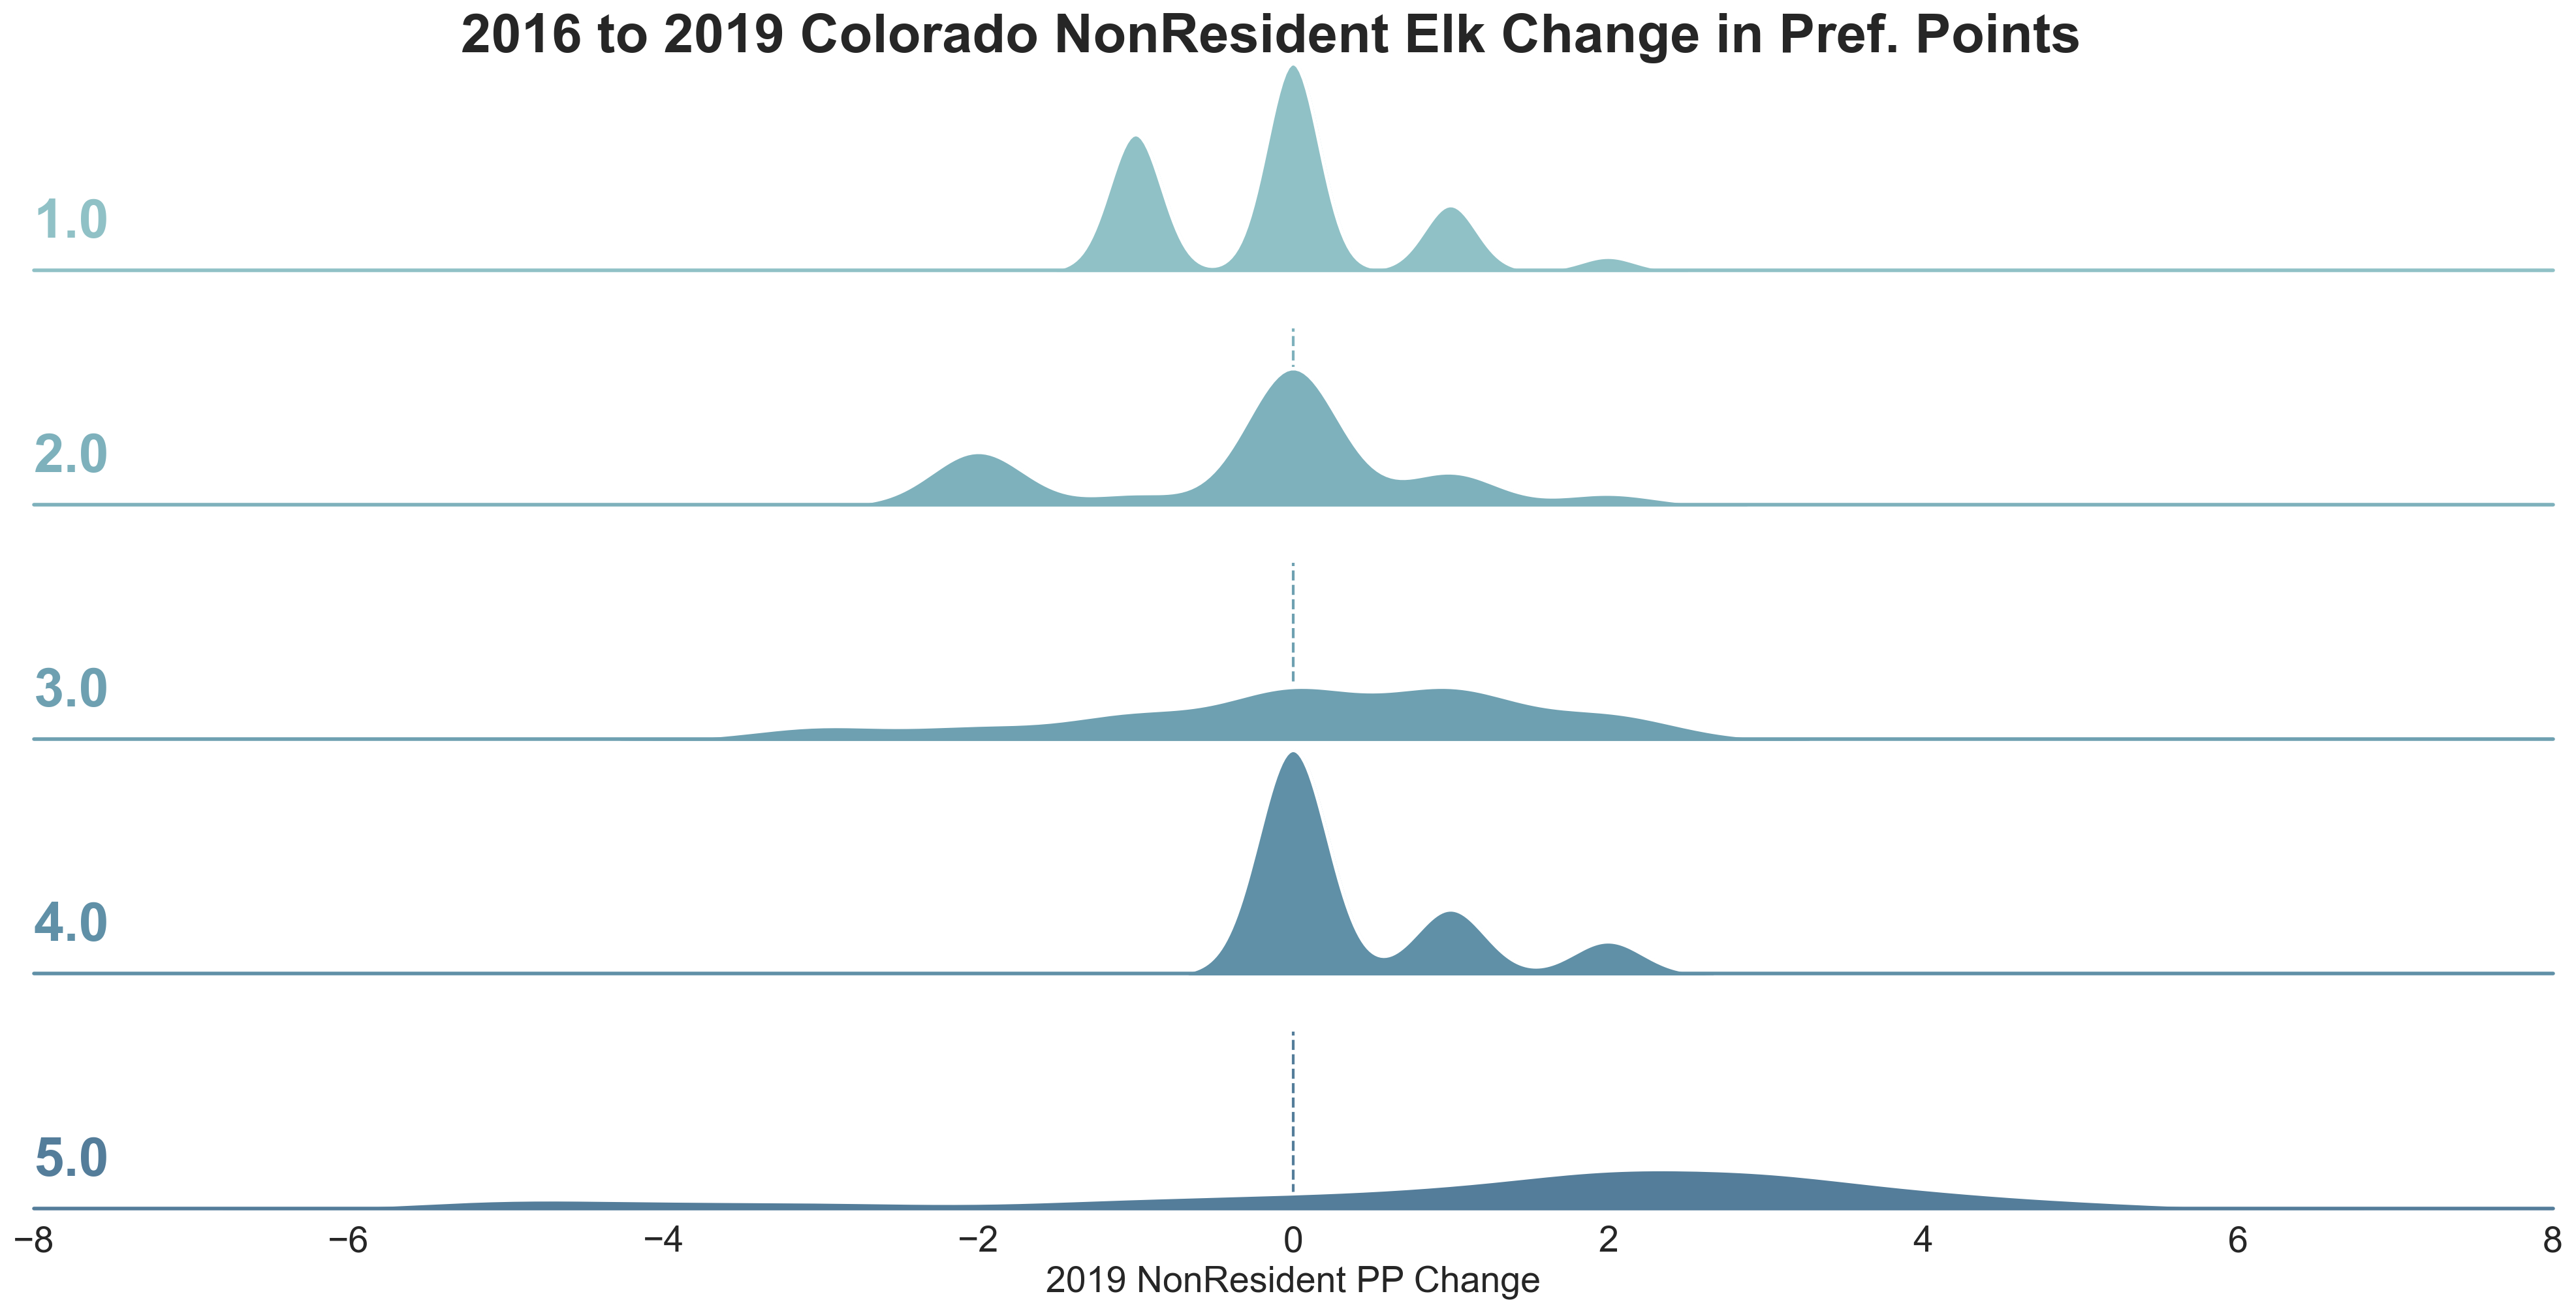
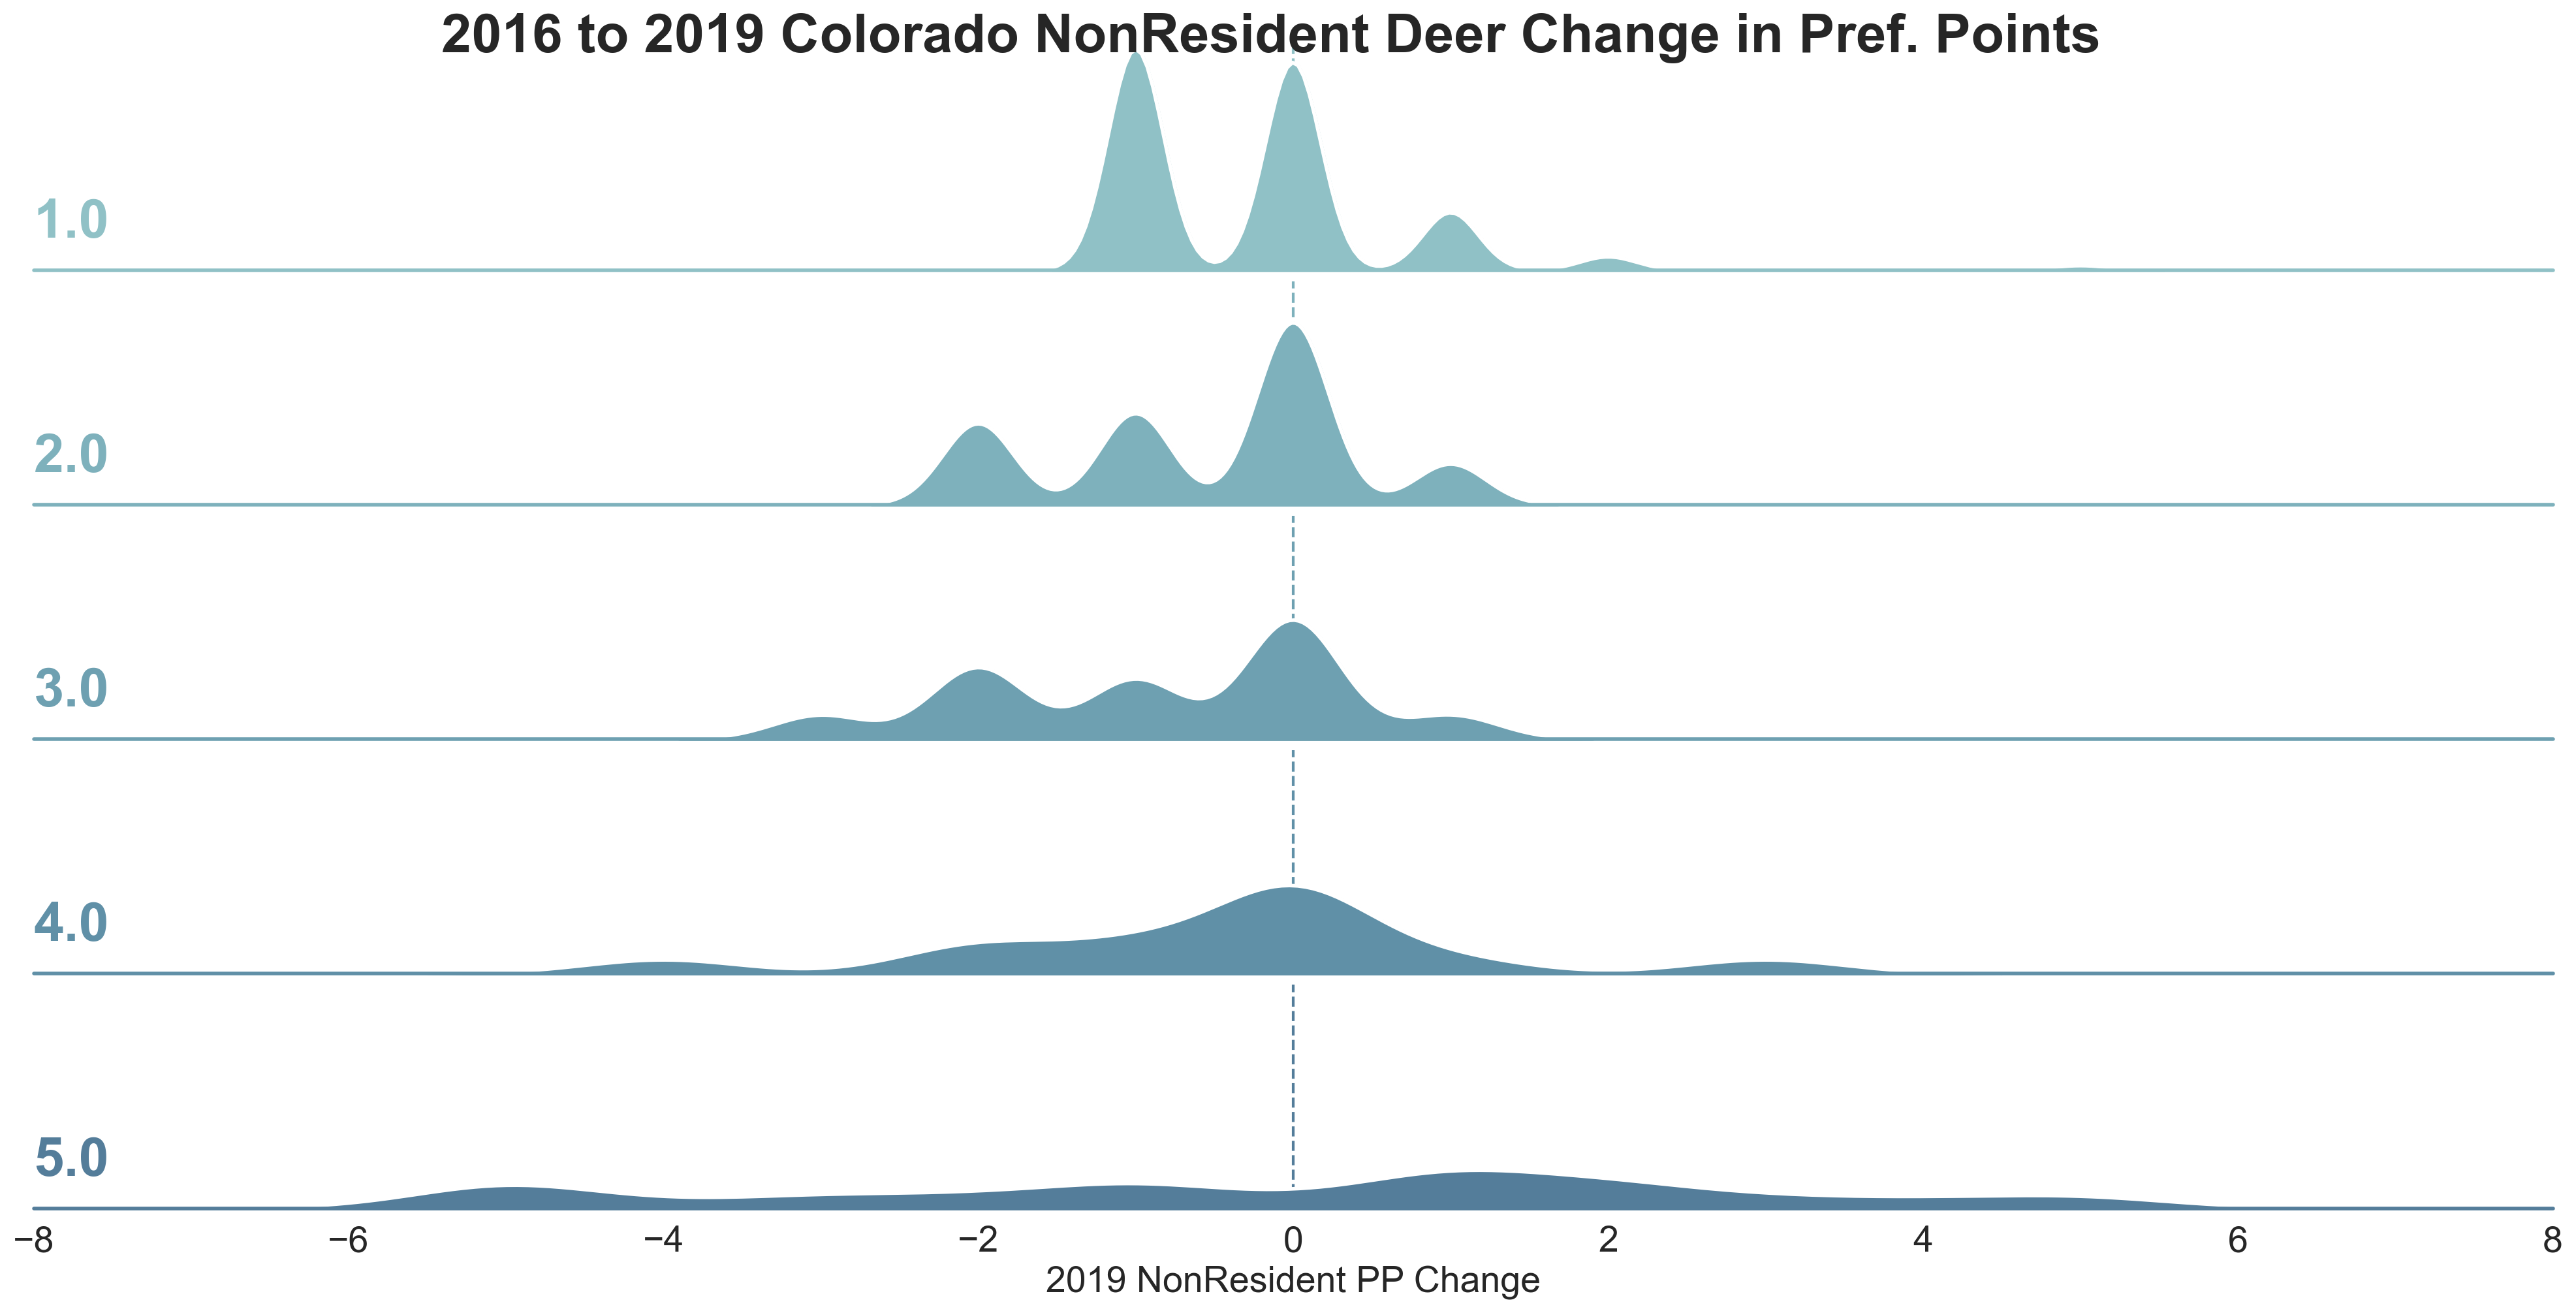
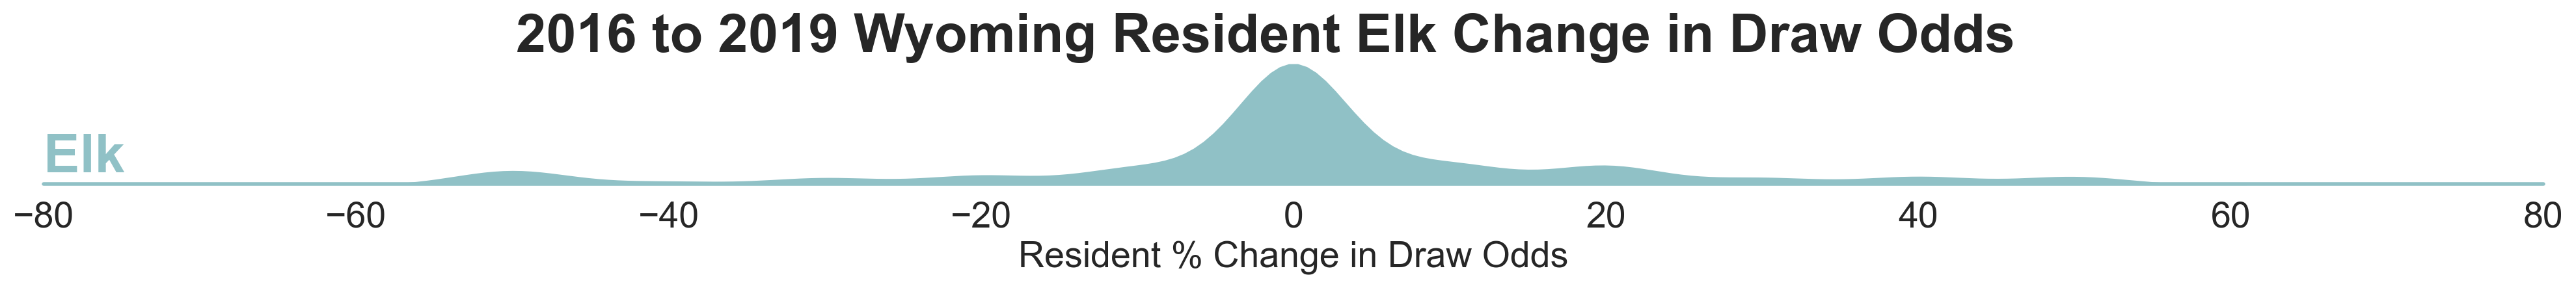
Below we show the final graph from above for resident and nonresident Colorado deer and elk draws. By comparison, we also show Wyoming resident & nonresident deer and elk draws. The takeaways are as follows:
- Colorado resident & nonresident deer hunters are seeing point de-creep! More units are getting easier to draw.
- Colorado nonresident elk hunters are seeing slight point creep in tougher to draw units but some units are declining as well.
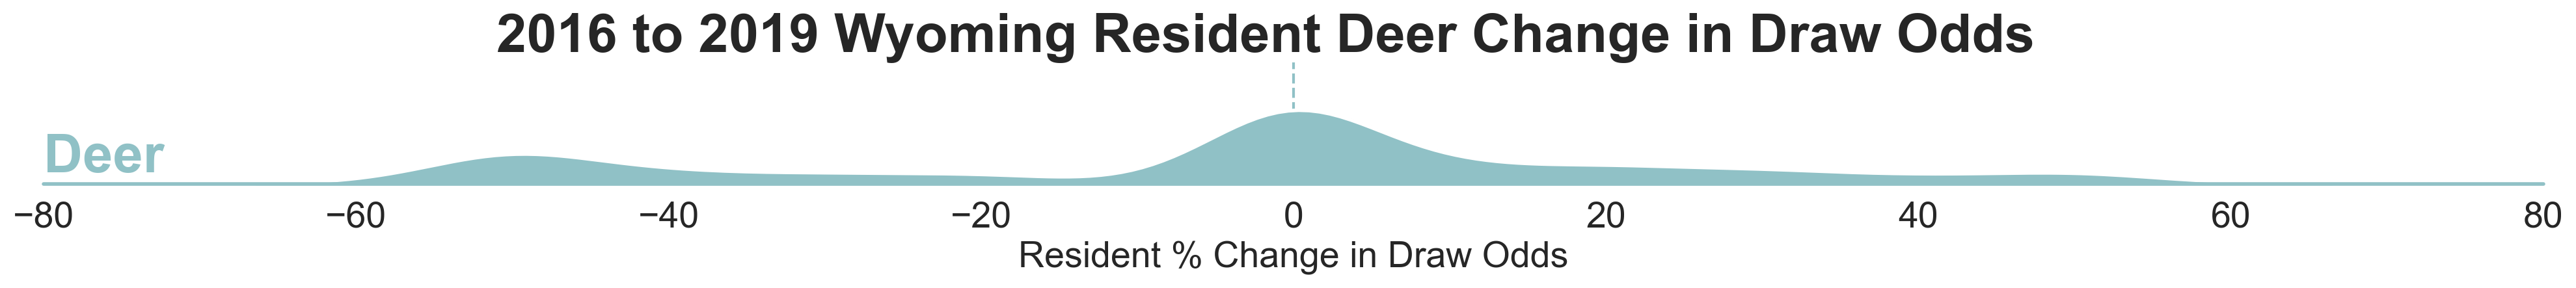
- Wyoming resident elk and deer hunters have seen slight increases in the difficulty to draw a tag. The plot shows some weight to right where we've inverted the scale. So +10% means the draw odds have gotten worse (or actually declined).
- Wyoming nonresident elk hunters are seeing astounding point creep with most minimum preference point tags increasing by 2 or 3 points.
- Wyoming nonresident deer hunters are seeing equally astounding point creep. Maybe all those nonresidents that used to hunt Colorado have migrated North?
While point creep doesn’t impact most draws, tags or permits it does impact a select few. We’ll keep noodling on how to effectively gauge point creep and the underlying drivers. Even for Wyoming nonresident hunters who are seeing widespread point creep where 1 or more points were previously needed, this only represents no more than 20% of available draws. It's a nontrivial amount but there is still plenty of opportunity out there.
Colorado Resident Deer
Colorado NonResident Elk
Colorado NonResident Deer
Wyoming Resident Elk
Wyoming Resident Deer
Wyoming NonResident Elk
Wyoming NonResident Deer